As an email marketer, I’m always striving to make improvements to my campaigns to maximize open and click-through rates. One of the main ways I achieve this is through split testing. I split test everything from subject lines and call to action buttons to images and body copy length. When I test the different elements in my campaigns, I often see a 1-3% increase or decrease in click-through and open rates. Yet, these jumps are minimal compared to the differences I see when I split test an image-based email versus a text-based campaign.
Plain Text, Text-based and Image-based Emails – What’s the Difference?
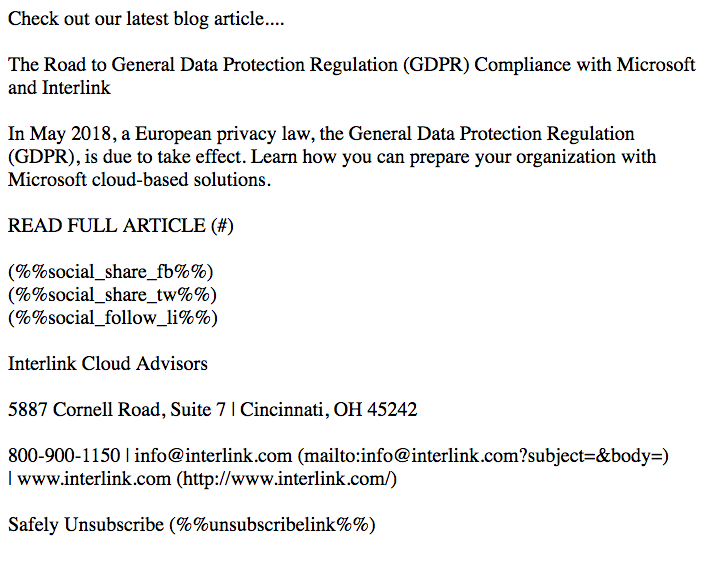
To be clear, both image-based and text-based emails use HTML, which is short for HyperText Markup Language. Email marketing platforms code their templates using HTML so you can easily format the design, text, and images. Most, if not all, email marketing service providers also provide you with a plain-text version of your campaign in case a subscriber doesn’t accept HTML emails. Plain text emails are an important part of your email marketing strategy, but they’re not the same as text-based emails. Plain text emails do not allow formatting, which means you can’t modify the campaign layout or change, bold, italicize, color, or underline the font. Nor can you add a clickable hyperlink. Check out the samples below to see the difference.
Image-Based Email

Text-Based Email
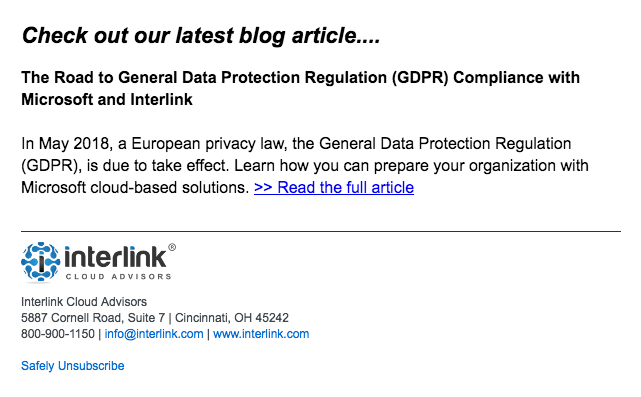
Plain Text Email
Testing Text-based vs Image-based Emails
Now that you have a clear understanding of the different email formats, I’ll focus on how click-through and open rates vary between text-based and image-based emails. I have a sampling of how these varied from both Business to Consumer (B2C) and Business to Business (B2B) campaigns.
Over the past few months, I have been creating text-based vs image-based split tests for many of the email campaigns I send out. I manage the email marketing for Pinpointe and a handful of Pinpointe’s customers, so I am able to pull data from multiple campaigns that have different target markets and databases. For each campaign, I do a 50/50 split that randomly chooses the contacts in each customer’s database. There are more advanced ways of doing split tests, but I chose to do the 50/50 split because I was only interested in how the two different email formats stacked up to one another. What I found was pretty interesting and may surprise you.
According to a report done by Brafton, a leader in content marketing, 82% of marketers believe their content is more likely to be consumed if it contains visual elements. As marketers, it has been ingrained in our minds that visuals are a critical part of promoting our product, service or even, and that includes email too — right?
Maybe not…
The Results
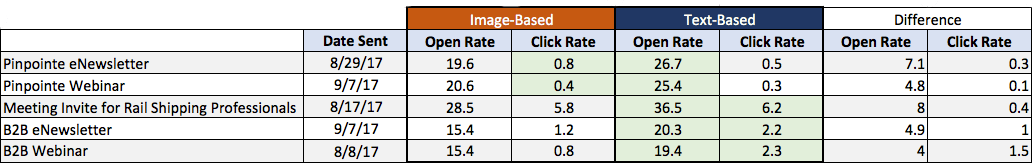
I pulled the results from five different email campaigns, each sent as a 50/50 split test, over the past two months. Two of the split test campaigns were sent to the Pinpointe database, which is primarily B2C contacts that have some type of sales or marketing role. One of the campaigns was an invitation to rail shipping professionals for a bi-annual meeting. The last two split test campaigns were sent from a technology company that focuses on cloud-based solutions. The contacts from that database are B2B and consist mostly of technical and business decision makers. The only similarities in the campaigns were that they were all sent from Pinpointe’s email marketing platform and each was written and designed by the same marketer.
Just to note, I sent about 20-25 split test campaigns over the past few months. The below are the results for only five of them. Yet, they are a good representation of the statistical patterns I saw in the results.
Open Rates
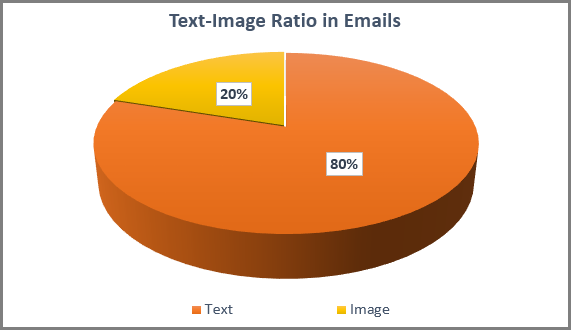
The open rate for text-based emails was significantly better for all of the campaigns I had sent. I used the same subject line for both the text-based and image-based emails; therefore, I would not have predicted such a big increase in the open rate. It went up over 7% for the Pinpointe eNewsletter. I believe deliverability most likely plays a key part in these results. Test-based messages generally achieve somewhat higher deliverability rates, since they require less bandwidth compared to deliver image-based campaigns. In addition, some internet service providers (ISP) block images because they cannot read them and image heavy emails with little text can also trigger spam filters. It’s recommended that you follow an 80:20 (80% text and 20% images) text to image ratio in emails, but I may not always hit the mark in the image-based eNewsletters I create and send out.
Click-Through Rates
As you can see from the results, the click through rates do not vary as much as the open rates. One thing I found fascinating was Pinpointe campaigns had a higher click through rate on the image-based emails. After seeing these results, I reviewed all of the image-based vs text-based email split tests I had sent out from Pinpointe over the past year and this result was consistent. I have to wonder…is it because I’m sending these campaigns to other marketers who tend to be more visual? That would be my first guess.
The other non-Pinpointe campaigns I pulled results for had a very different audience – mainly technical decision makers and C-level executives. Click through rates for the text-based emails increased up to 1.5%, which is a decent jump. There could be multiple factors that play into this, to include:
- Text-based emails come across as more personal, one-on-one communication
- Without images, the reader can focus solely on your message and the call to action link – reduced distractions mean higher conversions
What Results from Other Email Marketing Providers Say
Hubspot:
Hubspot evaluated the data from over half a billion marketing emails sent from their customers. The customers varied in the type of business and had different segments, list sizes, and list compositions. This is what they found:
For the simple HTML template (text-based) vs. HTML-heavy template (image-based), the text-based email had a 5.3% higher click-through rate and combined with the higher open rate, resulted in getting 30% more clicks.
Marketo:
Marketo sent 5 different text-based emails and this is what they found:
Text-based emails had:
- Roughly the same open rate as image-based emails
- 11% higher click to open rates (95% statistical significance)
- 8% higher click through rates (86% statistical significance)
Test for Yourself
Based on the statistical data around text-based vs. image-based emails, text-based emails are the victor. Yet, I still recommend that you do your own split testing. Your audience is unique and to understand what they prefer, you must test and re-test. Plus, I think it’s important to continue sending image-based emails that represent your brand. A mix of both types of emails is good and will keep your audience both visually and emotionally engaged.
Pinpointe makes it easy to create a split test for your text-based vs image-based email campaigns, so start testing your campaigns today.